Did Polymarket Beat a Simple Elo Model at the 2026 World Cup?
Scoring $2.67 billion of prediction-market prices against a rating table you could compute by hand, across 101 matches.
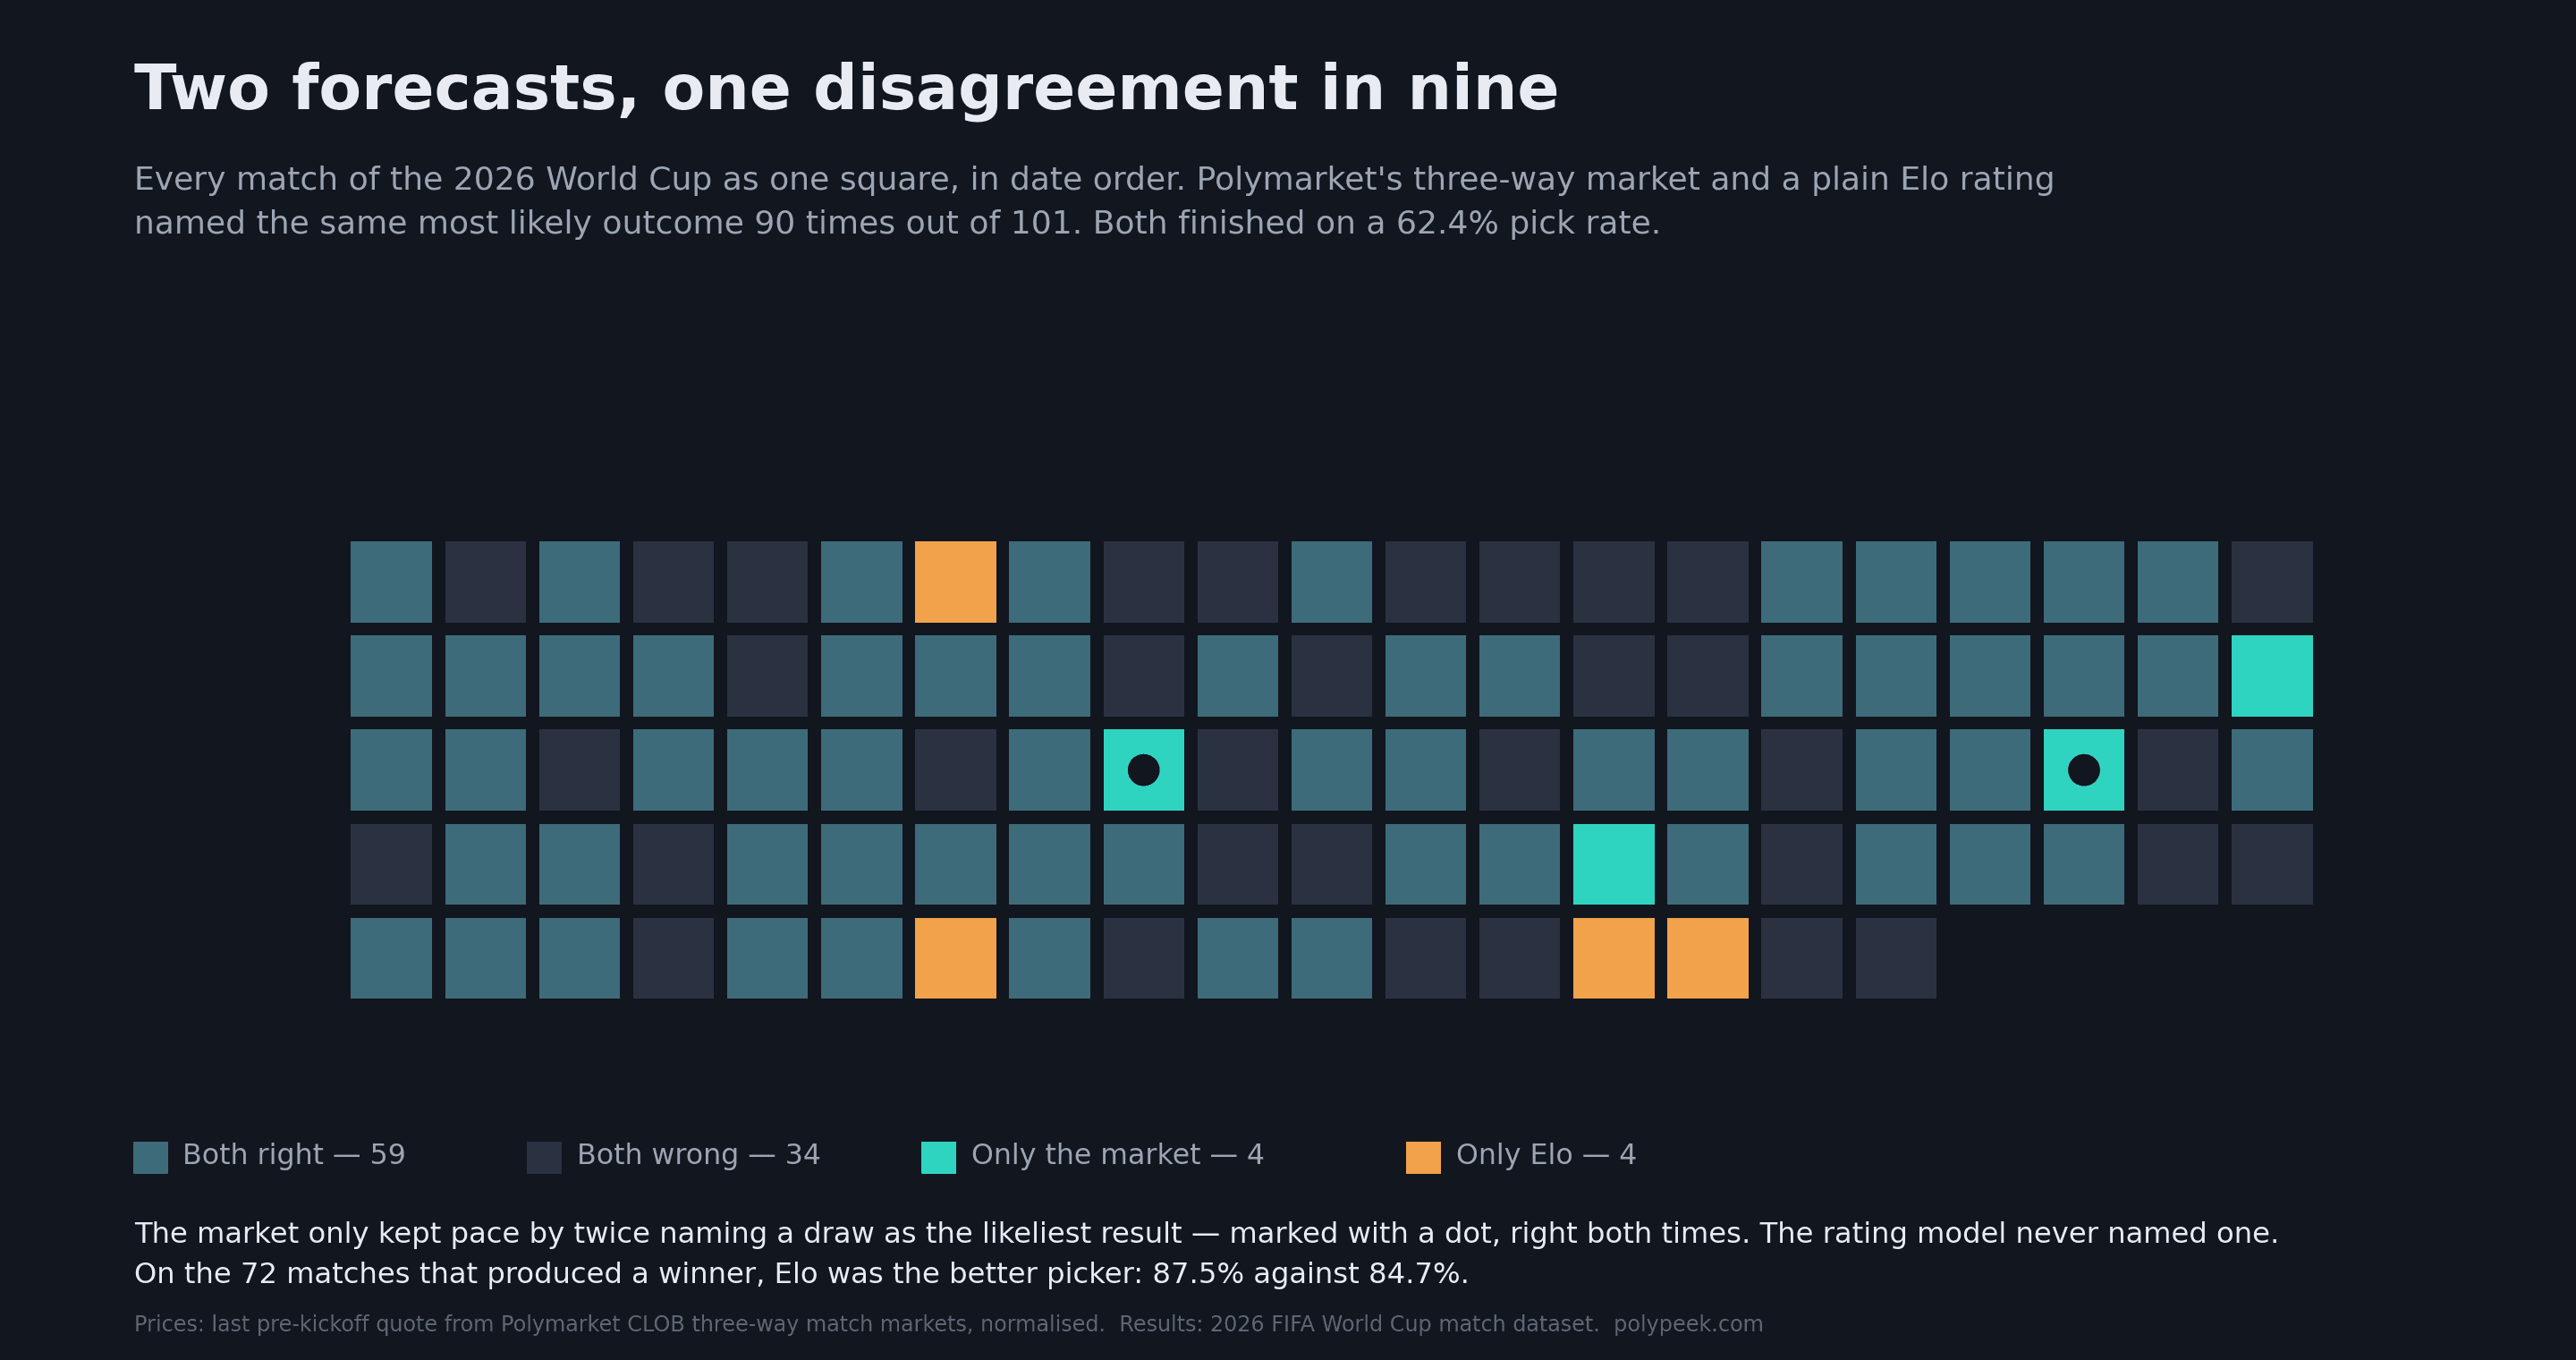
Across 101 matches of the 2026 World Cup, Polymarket's three-way markets and a plain Elo rating — pre-tournament ratings, no updating, no injury news, no tactics — named the same most likely outcome 90 times. Where they disagreed, they split four apiece and both missed the other three. Both finished on a 62.4% pick rate.
About $2.67 billion changed hands across those markets, a median of $25.4 million per game. It did not buy a single extra correct call.
It is worth knowing what 62.4% means here. Draws happened in 28.7% of matches, and neither forecast names a draw as its single likeliest outcome more than twice — so the ceiling was 71.3%. Both landed at 87.5% of what was reachable.
They got there differently. On the 72 matches that produced a winner, the rating table was the better picker: 87.5%against the market's 84.7%. The market drew level only because it twice named a draw as the likeliest result and was right both times. The model never named one at all.
What the money did buy
The market was still better. Just not at picking winners.
Scored on Brier — which rewards saying 70% when you mean 70%, rather than merely getting the ranking right — the market came in at 0.5014 against the model's 0.5278. A no-skill forecast that puts a third on each outcome scores 0.6667.
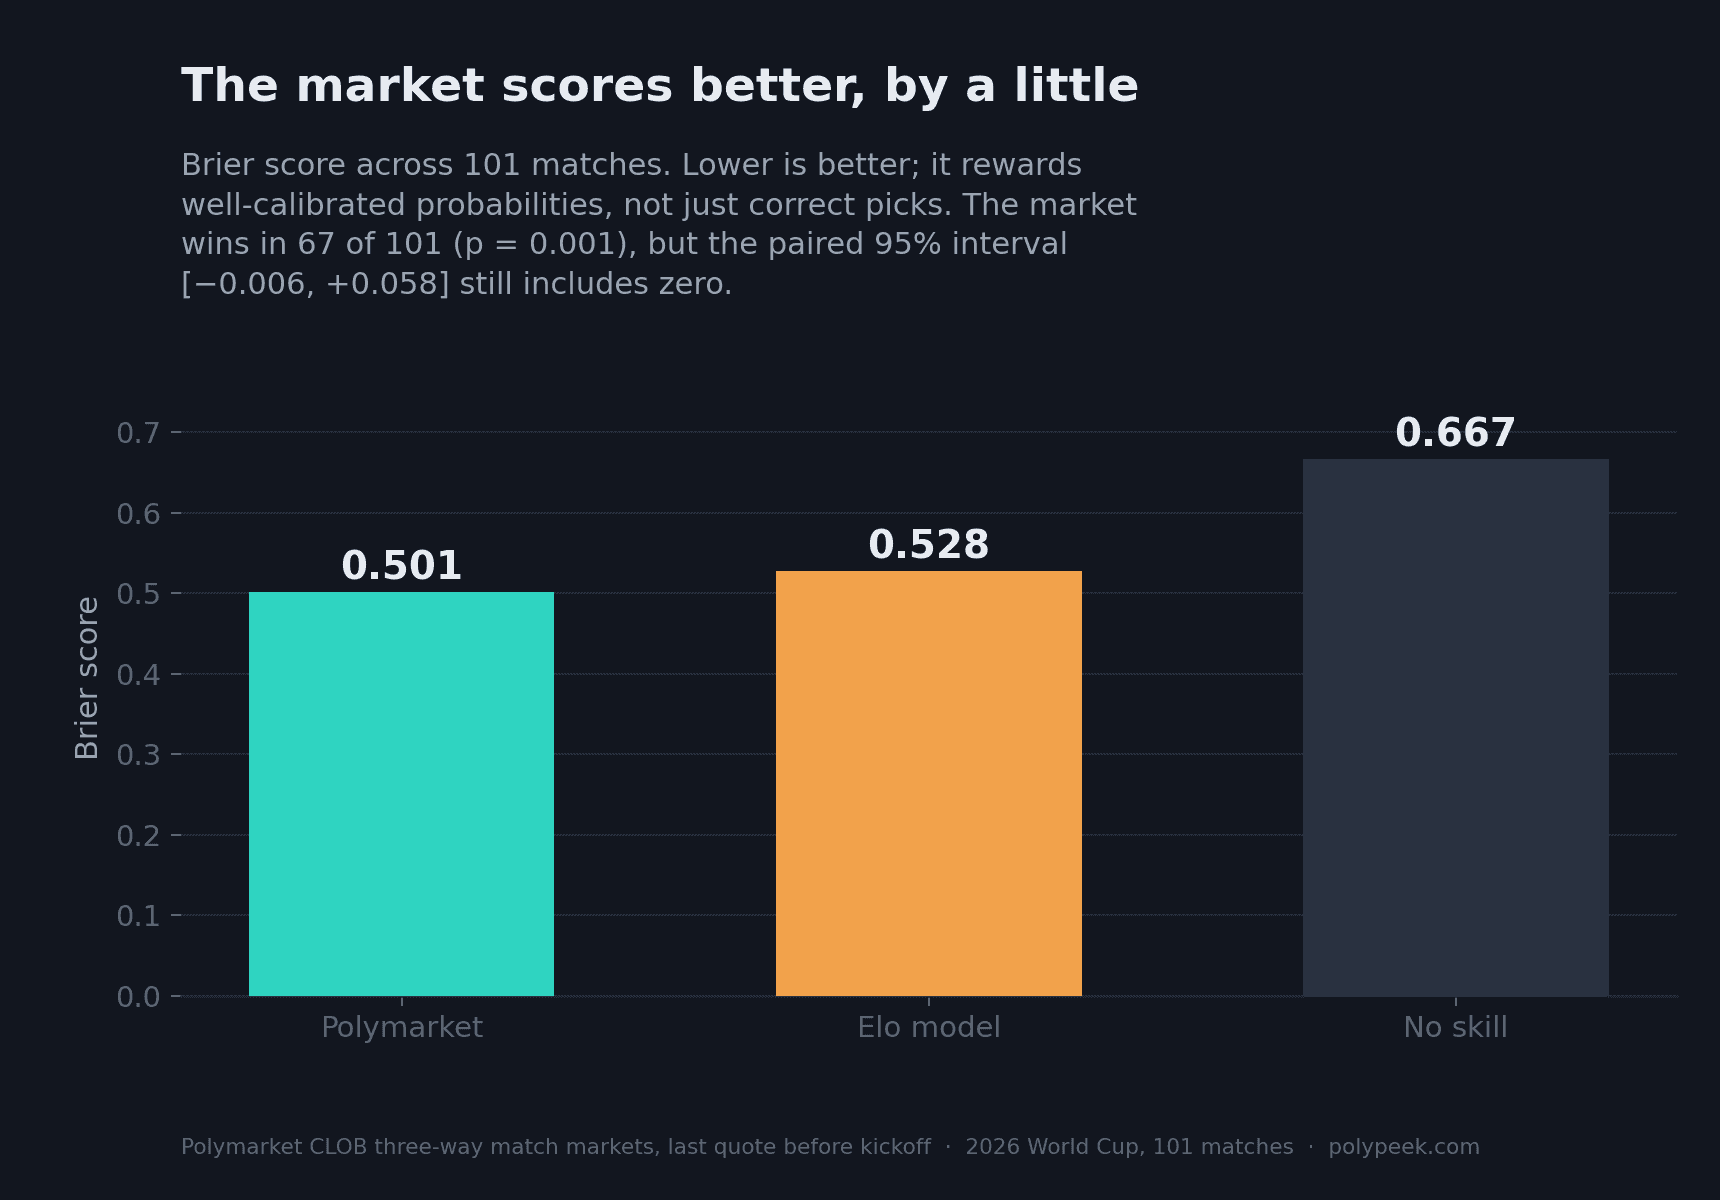
The advantage is consistent. The market posted the better score in 67 of 101 matches, a sign test at p = 0.001, and log loss agrees on direction: 0.847 against 0.891.
It is also small, and honesty requires saying so plainly. A paired test on the average gap gives p = 0.11, with a bootstrap 95% interval of [−0.006, +0.058] that includes zero. The market wins often, by a little. It loses rarely, by a lot. Those rare losses eat the average.
We stress-tested the baseline rather than leaving it a soft target. Its draw parameter is fixed at the historical 25% rate for tournament football, not fitted to 2026 — fitting it would hand the model information nobody had in June. Refit it to the draw rate this tournament actually produced and it improves to 0.5245. The market still wins. The result is not an artefact of a handicapped baseline.
Does 70% mean 70%?
Group every match by how confident each forecast was in its own favourite, then check how often that favourite actually won.
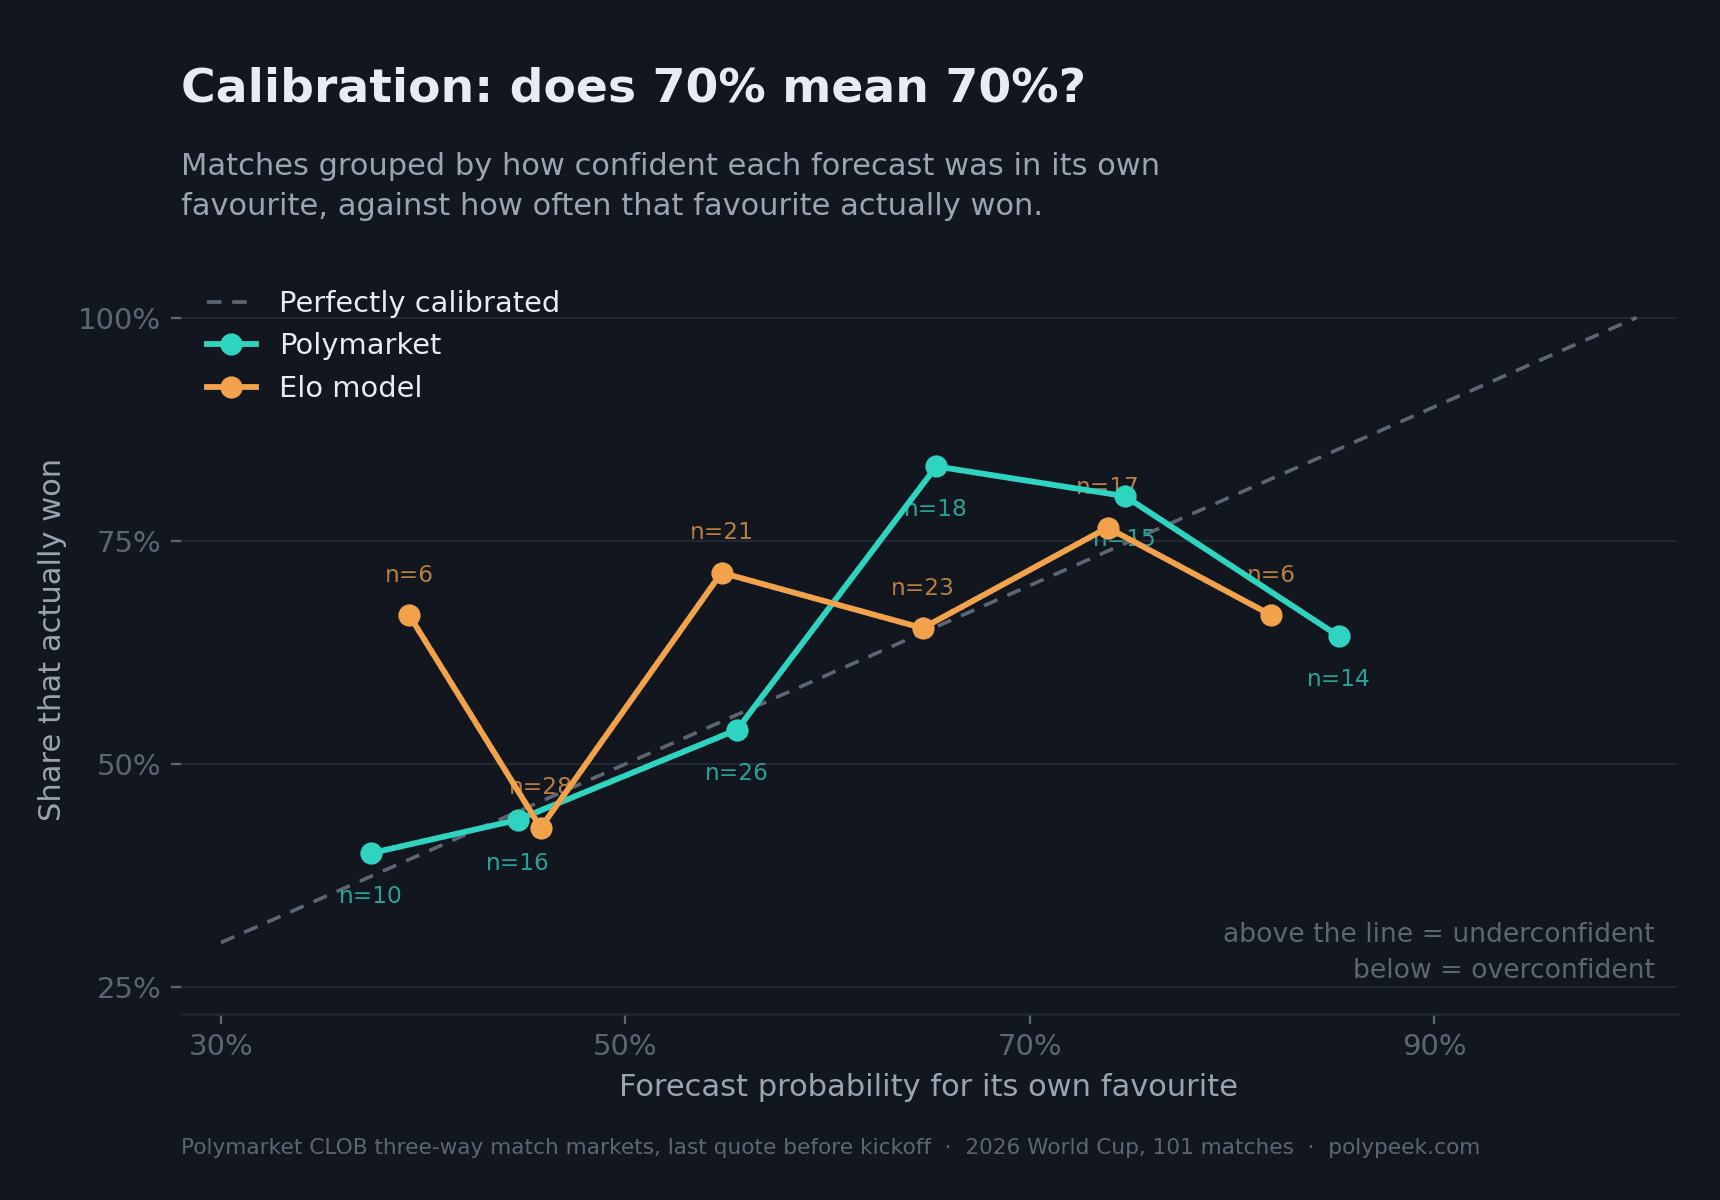
Both track the diagonal reasonably. The market sits slightly above it through the middle of the range, meaning it was mildly underconfident: when it said 65%, favourites won about 83% of the time. The rating model wanders further in both directions. The one place the market falls below the line matters, and it has a name.
The blind spot both forecasts shared
Draws happened in 28.7% of matches. The market priced them at 22.8%. The Elo model said 21.4%.
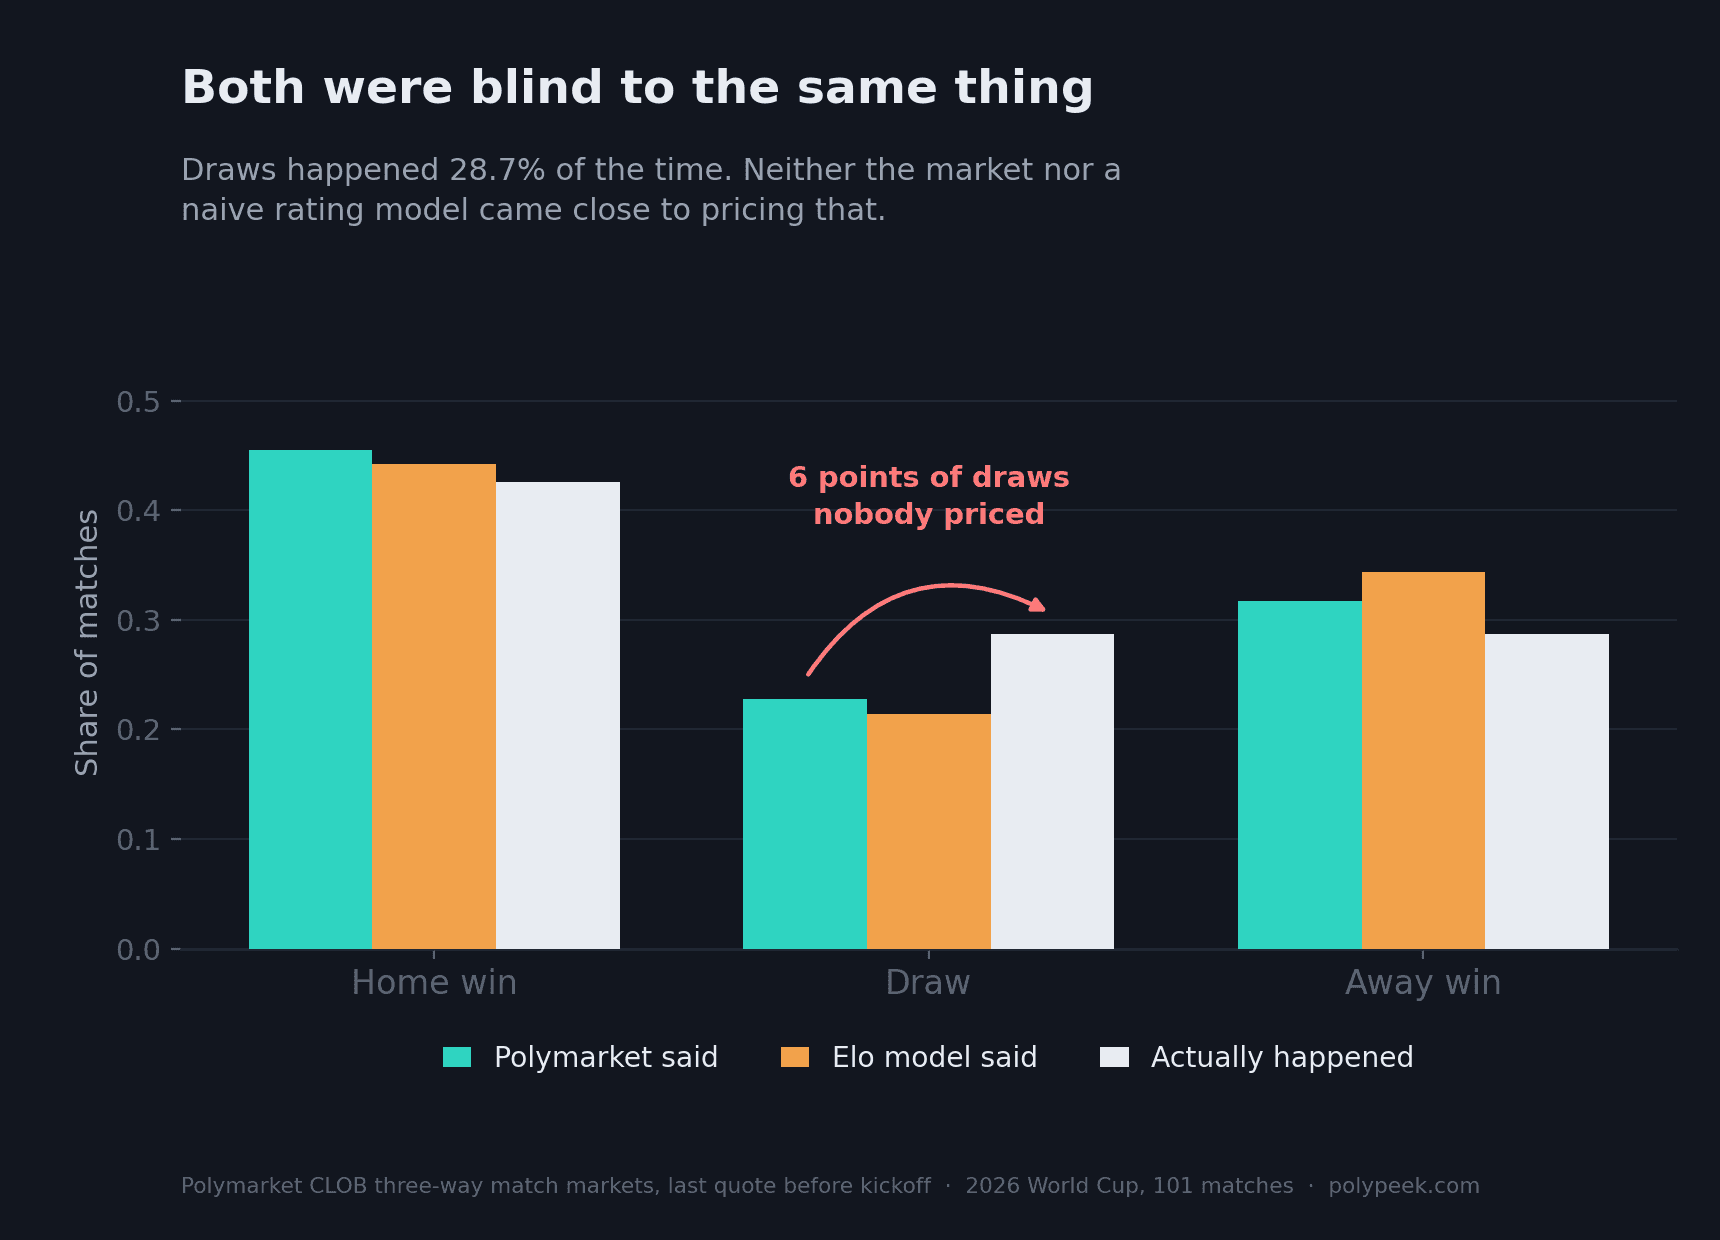
The crowd inherited the naive model's blind spot almost intact. Whatever collective intelligence $2.67 billion buys, it did not buy an understanding of how often World Cup football ends level.
So where did the edge come from? Take the Elo model and swap in only the market's away-win probabilities, leaving the rest naive. The score improves from 0.5278 to 0.5112— roughly two-thirds of the market's entire advantage, from one dimension. The market's real skill was knowing when a visiting side would win. On draws it was barely better than arithmetic.
One failure mode, six times
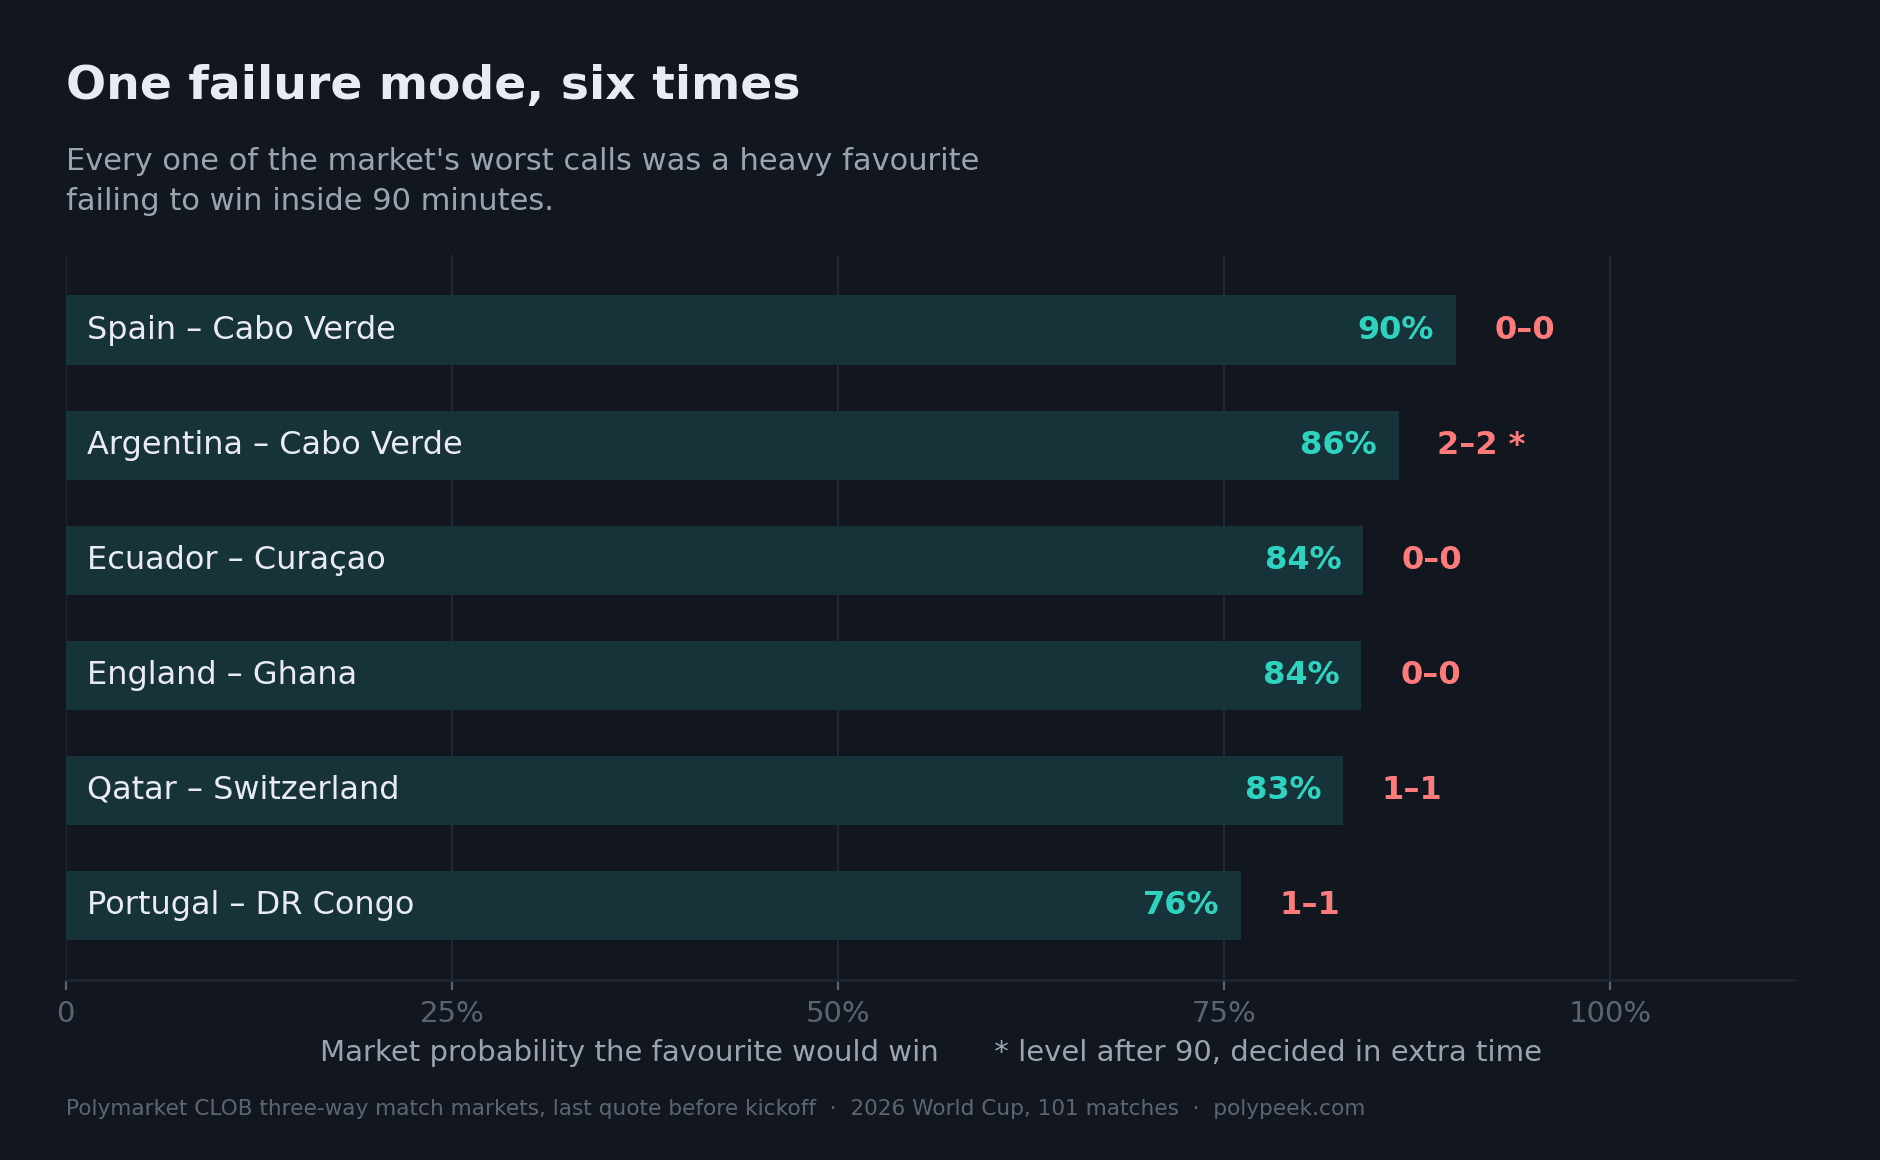
The market's six worst individual calls all look the same.
| Fixture | Market gave the favourite | Result |
|---|---|---|
| Spain – Cabo Verde | 90.0% | 0–0 |
| Argentina – Cabo Verde | 86.3% | 2–2, extra time |
| Ecuador – Curaçao | 84.0% | 0–0 |
| England – Ghana | 83.9% | 0–0 |
| Qatar – Switzerland | 82.7% | 1–1 |
| Portugal – DR Congo | 76.1% | 1–1 |
Every one is a heavy favourite failing to win inside 90 minutes. Across the 14 matches where the market priced a favourite between 80% and 90%, it expected 11.9 wins and got 9 (binomial p = 0.043 — one bucket among several, so treat it as a lead rather than a finding).
The interesting part is that the market cansee a stalemate coming. Before Algeria–Austria it priced the draw at 46.7% against the model's 24.6%. The match finished 3–3. The crowd knows how to price a grind. It just stops doing it when a giant plays a minnow.
The knockout reversal
Split the tournament and the picture inverts.
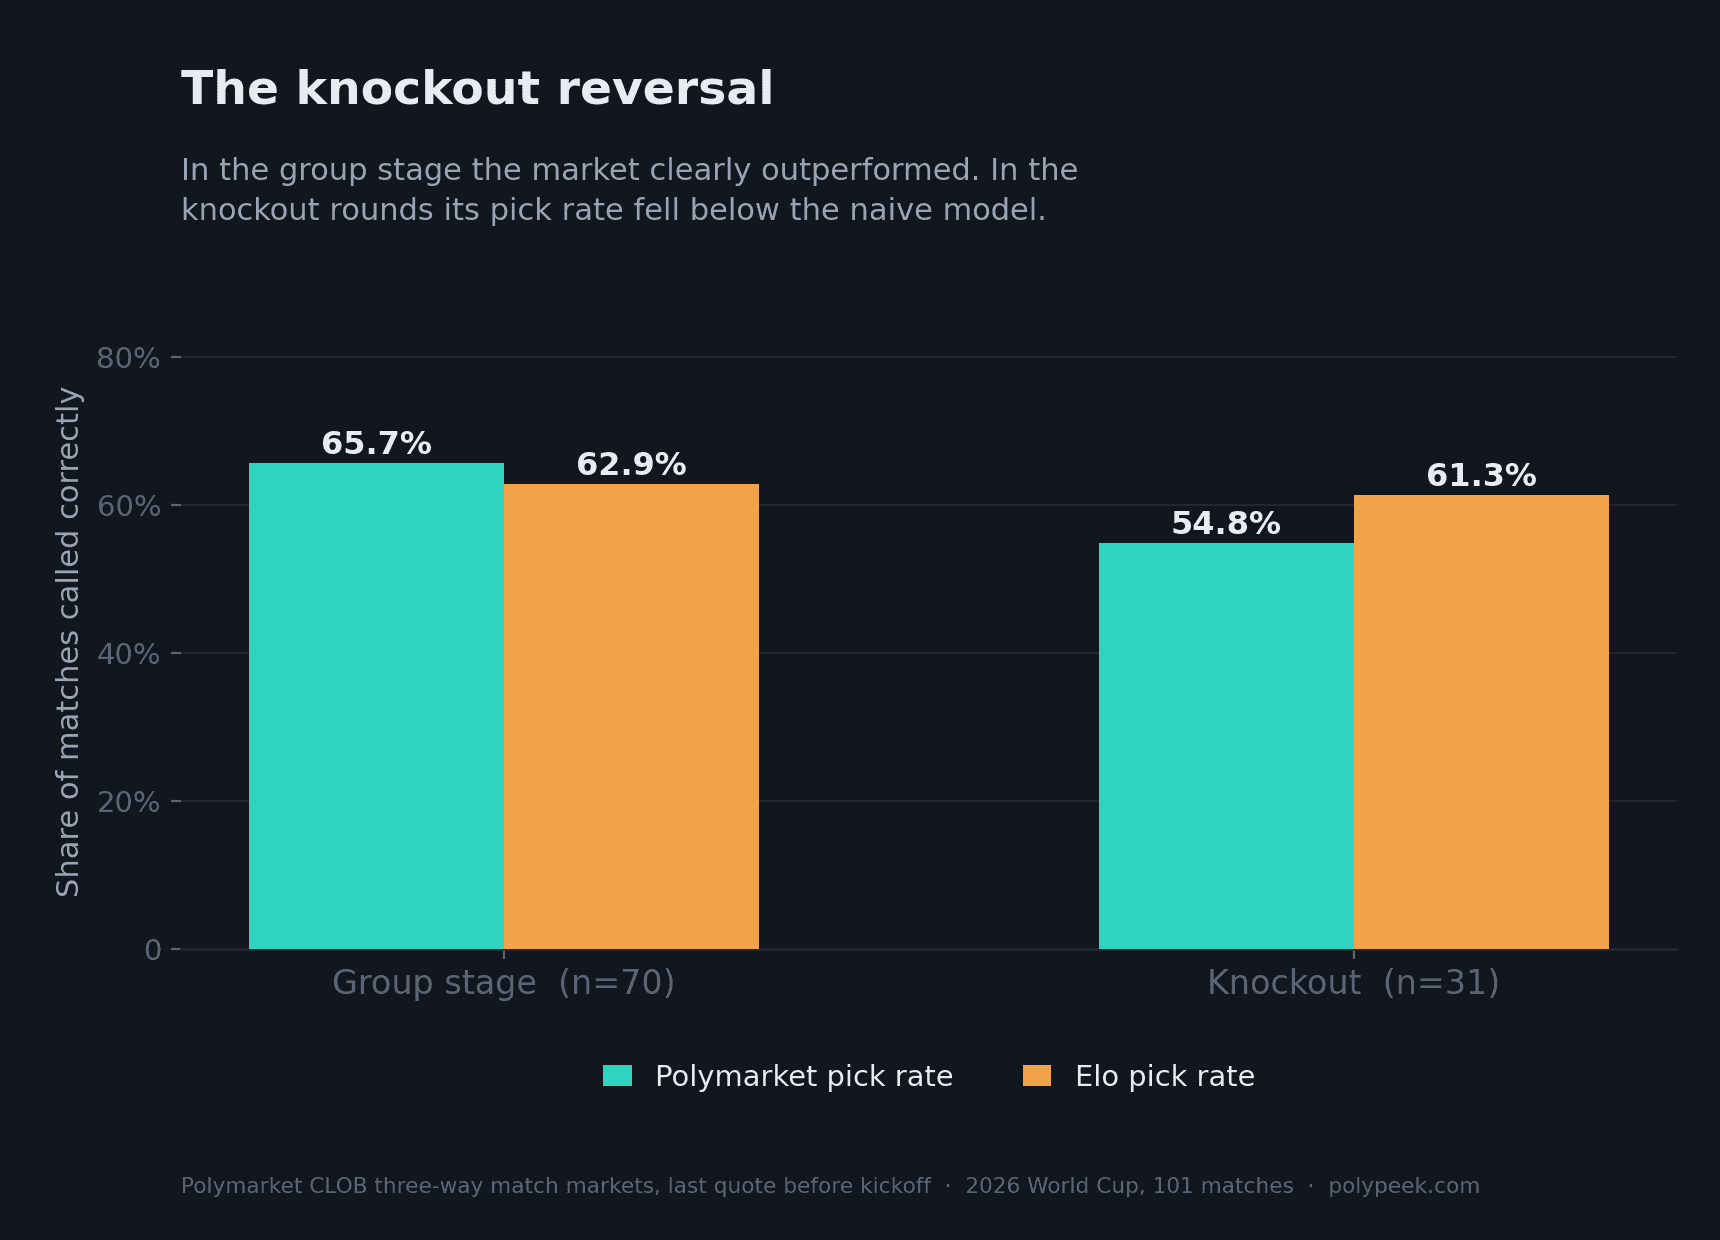
In the 70 group matches the market clearly outperformed on Brier too, 0.4820 against 0.5143. In the 31 knockout matches its Brier edge nearly vanishes (0.5452 against 0.5584) and its pick rate falls below the baseline.
With 31 matches this is thin, so we are not claiming the crowd wilts under pressure. But there is a mechanical reason it might be real: knockout ties that finish level go to extra time, and a market resolving on the 90-minute result has to price a draw it may not want to price. We did not exclude the knockout rounds, because excluding them after seeing the split would be choosing the answer.
The margin was essentially zero
Sum the three legs of each match at the last pre-kickoff price and the mean is 1.0013 — thirteen basis points of overround. The median is 1.0050. A sportsbook three-way market typically runs 5 to 7 percent over.
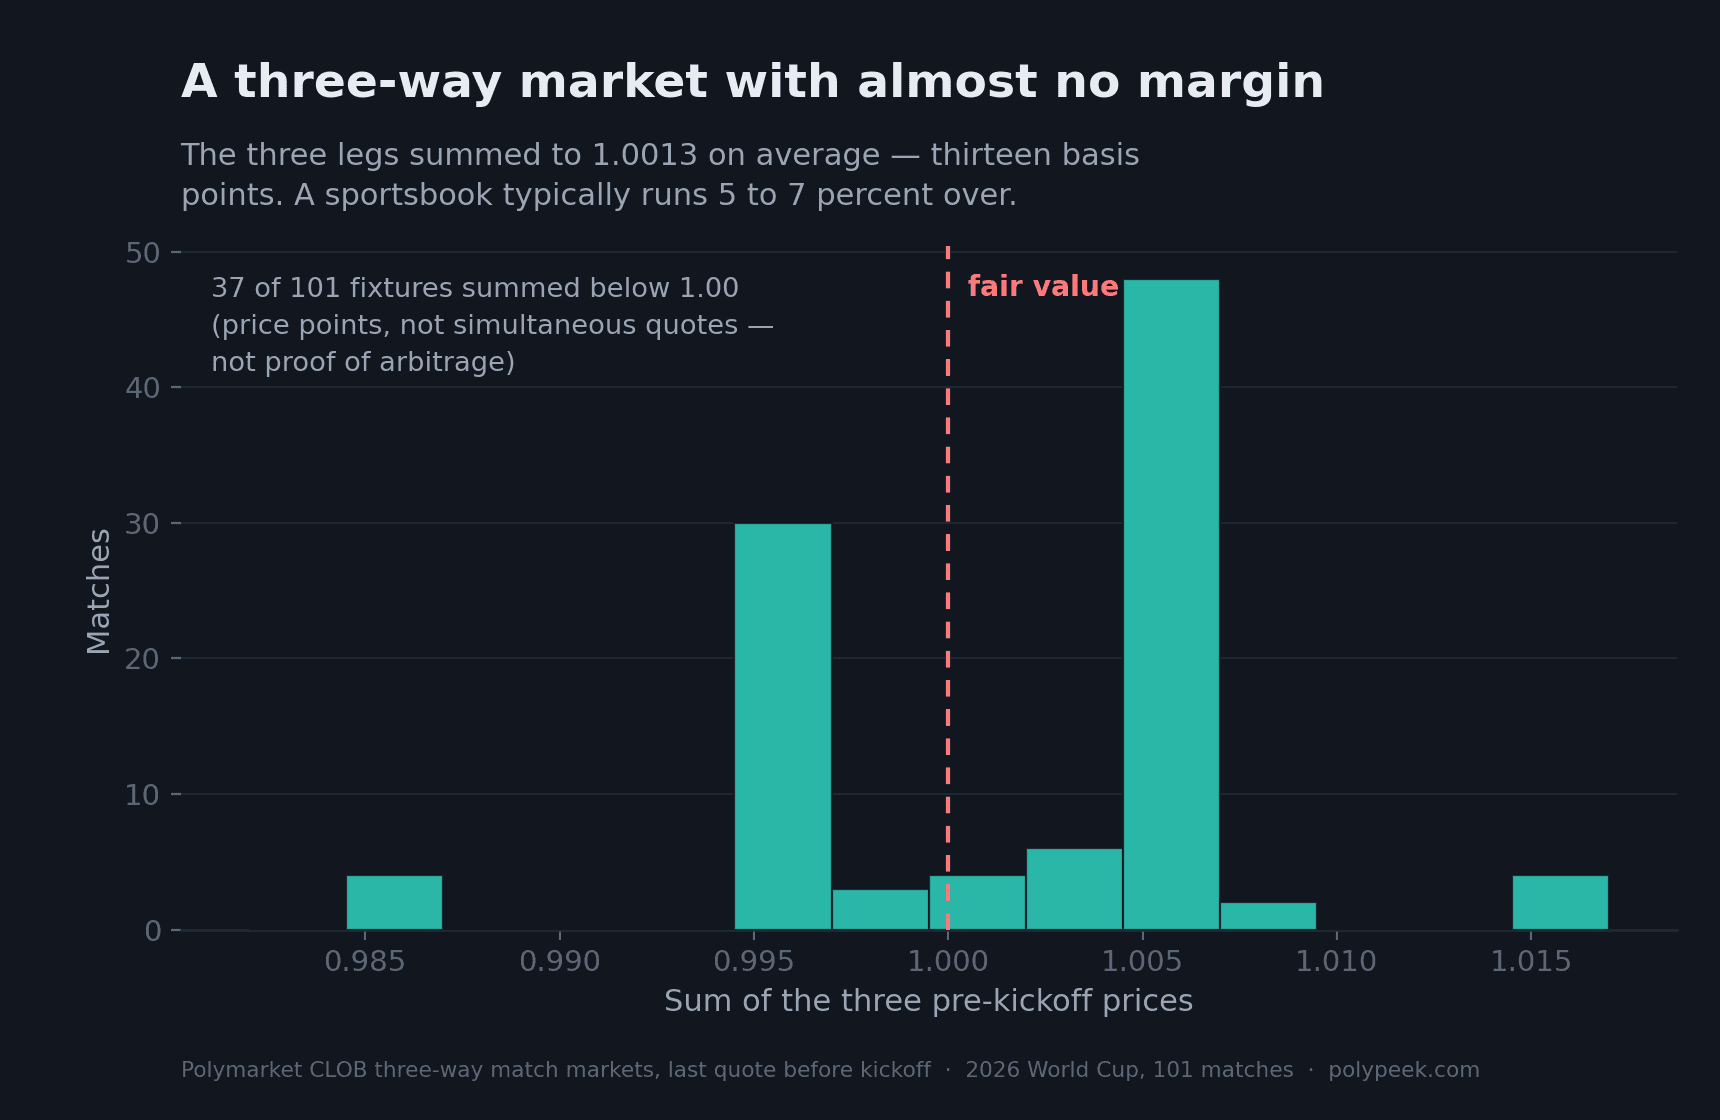
That is not proof of free money: these are historical price points rather than simultaneous executable quotes, and legs can be stale relative to each other. But it does say something about how tightly this market was priced.
Methods
Prices
Results
Baseline
Exclusions
A warning for anyone using the same dataset
kickoff_time_utc column is unreliable. Checked against Polymarket's own gameStartTime, it was off by anywhere from −9.5 to +6 hours and exactly right in only 9 of 46 cases. Our first run trusted it, which pushed the price window past full time and produced “forecasts” like [0.999, 0.0005, 0.0005] — post-match settlements dressed up as predictions, scoring a triumphant 82.6% accuracy. If a prediction-market backtest looks brilliant, check the timestamps before checking the thesis.What this is worth
One tournament, 101 matches, a small and statistically shaky average edge. Nobody should conclude from this that prediction markets are or are not efficient.
What survives is narrower and more useful. Money moved the probabilities in the right direction, mostly along one dimension, without improving the pick rate at all. And a systematic error that a rating table makes — refusing to price the stalemate when a big team meets a small one — survived contact with $2.67 billion.
That is a more interesting thing to know than whether the crowd won.